User:Crecasens
From IGEP - ISEE Wiki
Overview
This is the 1/3 chapter of the Getting Started with IGEP RADAR LAMBDA Tutorial Guide. In this first chapter, we will learn:
- Connect the radar to a PC via Ethernet.
- Boot the board with the default firmware.
- Make first measurements using web server demo application.
Upon completion, you will be ready to continue with chapter 2/3 that explains more advanced tasks.
Contents
- 1 Overview
- 2 Requirements
- 3 Getting started
- 4 Next Steps
Requirements
In this tutorial we are going to use the following materials:
- IGEP RADAR LAMBDA with its power supply
- Network cable
- PC with keyboard, mouse and monitor
Getting started
Please follow the next steps as indicated. You could change later the way you use the radar but it is very important you follow these instructions at least once for the first time:
Place the Radar on a stable surface
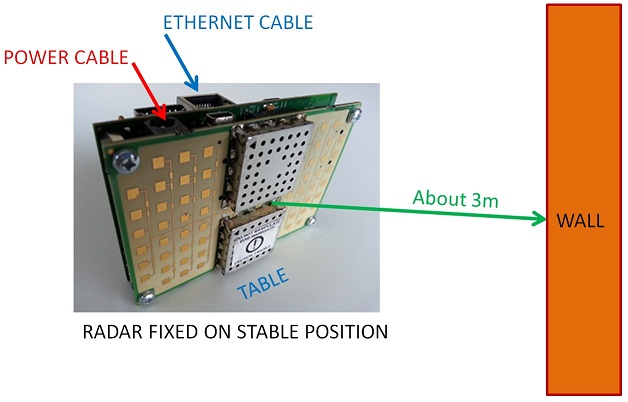
Place the radar over your desk and oriented with the ORION board (antenna) facing a wall of your office with nothing in between. A distance of about 3 meters between the radar and the wall would be good to make the first measurement.
Network
You may now plug the Ethernet cable into the 10/100 Ethernet jack of the IGEPv2 board of the radar to get network access. The default firmware configures the Ethernet device with static ip address (192.168.2.232). Start your PC and plug the Ethernet cable to it.
Source Power
Now, before you apply the source power to the radar, ensure the equipment is fixed over your desk and the cables do not move the radar. Once the radar is fixed facing to the wall, you can power it through any of its power connectors: J200 on IGEPv2 board or JP1 on ORION board. Remember you can power the radar through any of both connectors but never apply power to both at the same time. Here there is a diagram of an ideal measurement over a wall:
Wait few minutes
Once you apply power, please wait a few minutes while IGEPv2 board boots with the default firmware flashed on the internal memory. You will see LEDs from IGPv2 board blinking until system has booted, then you will see a fixed lighted green LED.
Run Web Browser on PC
Run a web browser on your PC with the ability to work with gnuplot4.6. We recommend the use of "Mozzilla FireFox" web browser that you can install and download for free at: http://www.mozilla.org/en-US/
Connect to Radar IP
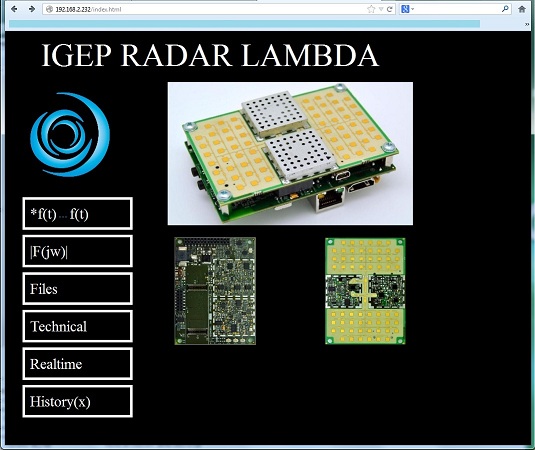
Put the radar IP 192.168.2.232 on the web browser. If the radar has already started you will see the Home page of the web radar application demo, if not, please be patient and wait a little bit more until the radar starts. You will see a home page similar to this one:
Do not worry if your home page differs from the picture, there are some different versions and you will have the last one for sure.
Make your first measurement
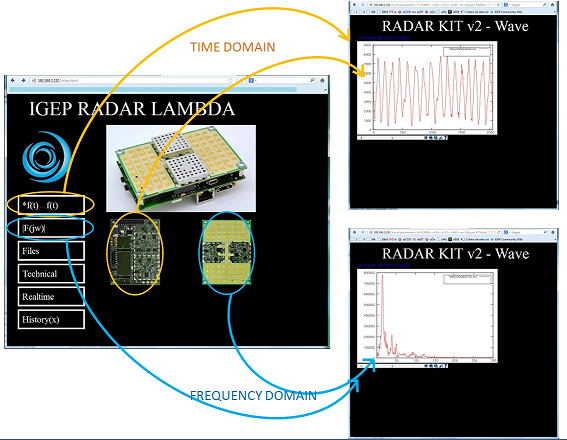
To see the time domain IF radar signal in pseudo-real time, you can click on any of the yellow marked icons: You should see a wave similar to the picture, this is a dominant sinus.
To see the frequency domain IF radar signal in pseudo-real time, you can click on any of the blue marked icons: You should see a signal similar to the picture, this is a big peak in the first samples.
We will learn later the meanning of these graphics.
Be aware the application demo is designed to work on an environment with only a single target scenario so it is very probably you may see quite different signals than the presented here due to multiple reflections in your room, but this is normal, and this is the power of the radar to detect multiple objects at the same time, we encourage you to develop your own application and process the IF signal information to detect not only one but several objects. See next guides if you want to learn more about this. To be sure your radar works well, we recommend you find an adequate environment without multiple reflections before to make any wrong conclusions.
What is Time domain signal
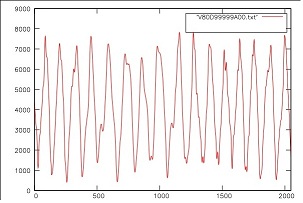
The time domain signal window shows the 2048 samples captured of the IF radar signal on the last measurement.
Y axis represents the signal voltage.
X axis is the sample number.
In the picture a measurement using the default modulation over a wall about 3m distance from radar is shown. Considering that the time to get 2048 samples with the default modulation is 3,471ms and we can see about 16 periods of the sinusoidal signal this means that the dominant sinus shown below is about 4,609KHz frequency. The frequency of the IF radar signal is proportional to the distance from the radar to the target (in this case the wall).
We will learn later on next chapters how to know the sampling rate and time to get 2048 samples.
What's This?
Why I am getting this weird signal? It has no sense, my Radar does not works!
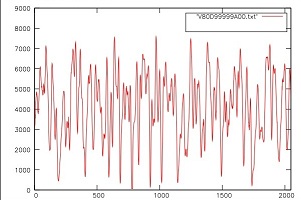
No. Please, be patient, this is completely normal, your radar works well. If you are getting a signal like this or even still more strange this means that you are detecting different objects. This signal is the result of adding different sinus waves with different frequencies resulting on an apparently noisy signal but in fact is a typical IF radar signal on a multitarget environment. Our main objective now is try to get a clear signal from a single target to start learning with the radar, so please try to slightly change the radar orientation in order to get only a single reflection, or if you are on a small room, try to go to a better scenario, on a wider room with few objects or simply outside close to a wall.
Basic FMCW Radar Theory
You can check chapter 9 of the user manual to get more in detail about radar theory. Basically, a Radar with continuous wave linear frequency modulation (FMCW) follow the next equation:
hzpm =2*BW/(V*T)
This equation gives the relation between the target distance and its corresponding IF frequency (hzpm) where:
hzpm: "Herz per meter" is the ratio between IF signal frequency (in Herz) and target distance from radar (in meters)
BW: RF output frequency bandwidth in Hz
V: media electromagnetic wave propagation speed (3*108m/s by default).
T: FM linear Modulation sweep time in seconds.
In our example, as the default modulation has the next paramenters:
BW=250MHz
T=1,311ms
V=3*108m/s
the resulting hzpm is 1271Hz/m
So, if the measured IF radar signal frequency is 4,609KHz it means the target is at a distance of 3,6m from the radar.
Considering the radar has an offset of about 0,35m (this is due to the microwave signal has this electrical lenght internally on the equipment before to reach the antenna) the real distance results in 3,25m
What is Frequency domain signal
The frequency domain signal is the result of applying the FFT to one ramp modulation interval of the 2048 sampled IF radar signal captured samples.
The radar application takes the samples of one single ramp and completes the rest with zeros (padding) completing 2048 samples, and it performs the FFT over these 2048 samples, resulting on the spectrum of the signal with 2048 points resolution.
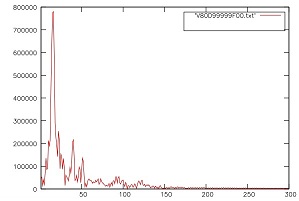
Following our example, the above picture shows the FFT of the measurement. Y axis represents signal strenght and X axis represents the FFT sample. Note that only the 300 first samples are shown.
We can see a dominant peak centered about sample number 16. This peak should correspond to the measured dominant sinus of 4,609KHz on time domain graphic.
The sampling rate used by the equipment with the default modulation is 590Ksps. This means that each sample of the FFT represents 590000/2047=288,2Hz.
If the peak is centered about sample 16 it means the frequency represented is 16*288,2Hz=4,611KHz, thus corresponding with accuracy with the calculations made on time domain.
We can see other small peaks at about samples 40 and 50. These peaks are due to other reflections on the room at a longer distance. So here an example of the possibilities of the radar to detect several targets at different distances. But by the moment is better if we pay our attention on a single target scenario to keep learning about the radar signal and later we will be able to analyse more complex scenarios.
Compare Measurements
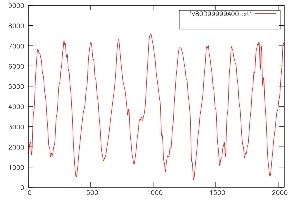
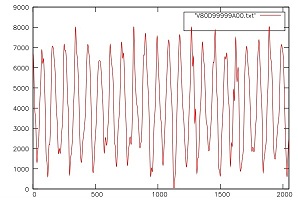
Now you can move the radar and make measurements over the wall at three different distances. For example, make a measurement with the radar at 2m distance and another measurement with the radar at 5m distance. You should get similar results as the following for 2m, 3m and 5m in order:
It can be clearly shown how the IF radar signal increases frequency when the target gets more and more distance from the equipment.
What is "Real Time" section
Now you can also make use of this web application demo feature.
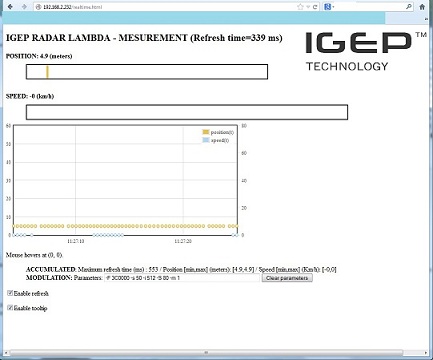
If you click on "Real Time" icon you will be able to continuously monitor the speed and the distance of a single target as much time as you need.
In case of a wall at 4.9m distance you should get something like this:
Note that in this case you get always the same position (4.9meters) and speed (0Km/h) as our target is a no moving object (wall).
You have a real time bar indicating the target range (orange) and another real time bar indicating the speed (blue).
There is also a graphic where:
Left Y axis: is the target range in meters.
Right Y axis: is the target speed in Km/h
X axis is time
Each point of the graph is one combined position-speed measurement, position in orange color and speed in blue color.
You can see on next chapter examples of real traffic measurements where you can see how the radar track the vehicles measuring its position and distance.
What is "Technical" section
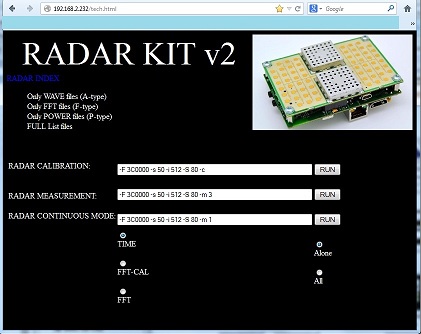
This is the most interesting feature of the web application demo. By clicking on "Technical" icon you will get access to the heart of the radar. You will be able to make measurements with the modulation you want, by simply prompting the parameters on the rectangles.
There are three sections:
SECTION-1: RADAR CALIBRATION
This feature is for advanced measurements and we do not recommend to use on this chapter. It will be explained later.
SECTION-2: RADAR MEASUREMENT
This feature is interesting if you want to use the web application demo as a console where you can configure the radar with different modulations and get the results prompted on the screen or saved on a text file.
You can see that the default parameters are: -F 3C0000 -s 50 -i 512 -S 80 -m 3. This is the same default modulation used on the Home Menu icons f(t) and F(jw). Now here you can remove these parameters and put what you want.
For example, put in this section the next commands:
-T 800 -m 20
and click on "RUN" button
-T 800 means you want a modulation with 0,8ms sweep time
-m 20 means that you want to make 20 consecutive measurements
You can check a complete explanation of each parameter on the user manual of the radar.
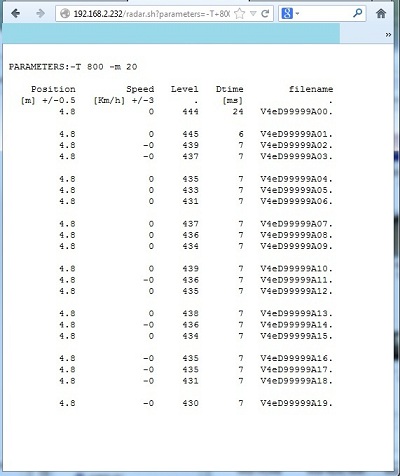
The result obtained over a wall at 4.8m distance is like this:
The screen shows the result of each of the 20 measurements done on 20 rows, one row per measurement:
1st column shows the measured target position (4.8m)
2nd column shows the measured target speed (in this case 0Km/h as the wall is no moving)
3rd column shows a value proportional to the measured signal strength.
4th column indicates the delta time between each measurement. In this example the radar did each measurement in only 7ms. This time includes the time to program the modulator, perform the ramp modulation, capture the IF radar signal with the ADC, process the data, and show the result.
Finally, the last column indicates the name of the captured file. IMPORTANT: This file will be generated and stored ONLY if you add the parameter -w
-w means that you want to write all the measurements on a file (there will be generated 20 files, one for each measurement, and each one with 2048 samples)
SECTION-3: RADAR CONTINUOUS MODE
This section is used to get the same graphics as the obtained on the Home Menu icons f(t) and F(jw), but in this case we can remove the default modulation and put the parameters we want. By checking on TIME or FFT we will obtain the time domain or the frequency domain graphic.
For example, remove the default modulation and put:
-T 1000
This will program the modulator with a 1ms modulation ramp. If you click the "RUN" button you will see in pseudo-real time the time domain or the frequency domain graph of the IF radar signal.
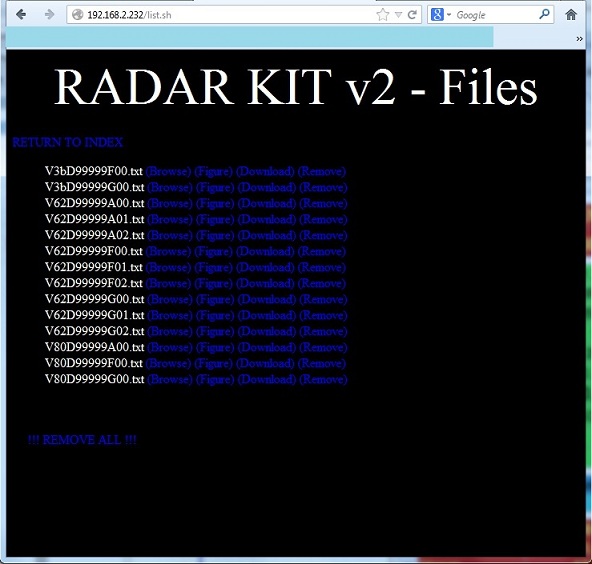
What is "Files" section
This is a feature of the web application demo that will help you to manage the captured files in your measurements. By clicking on "Files" icon you will be able to check all the captured files and you will have the possibility to:
-Browse: represent a time domain graphic of its contents.
-Figure. the same as before
-Download: Check the data contained on this file, this is a column with the 2048 samples of the IF radar signal. You can select and copy to a text file for post-processing
-Remove: click here if you want to remove this file
Check IGEP RADAR LAMBDA user manual if you want to know more about the meanning of the file names.
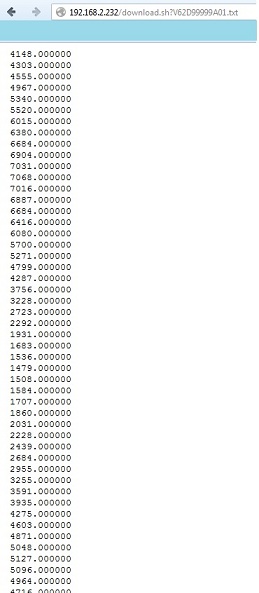
If you click on Download you will see something like this:
This is the list of 2048 samples captured on the measurement. You can select all or a part of the samples and copy to a text file for further data processing, for example with matlab or other powerful programs.
Next Steps
Congratulations! You have made your first measurements and started to understand how the radar works. You also know most of the features of the radar application demo. Now you are able to do the next steps with the radar and try to adapt it to your specific application.
You can go now to take a view of different radar applications on "What can I do with IGEP RADAR LAMBDA" section or go directly to the "Start developing with IGEP RADAR LAMBDA" section


